What this project is about?
This project analyzes a dataset of 5,000 anonymized comments from online Brexit discussions collected from social media spaces associated with three major campaign organizations: LeaveEU, VoteLeave,and StrongerIn. The goal of this project is to understand how political identity, discussion structure, and participation patterns shape online political conversations. By examining comment tone, engagement patterns, and interaction types, this project uses data visualization to explore how people communicate during politically polarized debates.
Each observation in the dataset represents one comment posted by a participant. The variables describe the commenter’s political position, the tone of the comment, the structure of the conversation, and the level of engagement generated. Together, these variables allow us to examine patterns of disagreement, participation inequality, and behavioral differences across political groups.
Variable Descriptions
Commenter_ID
A unique anonymized identifier assigned to each participant in the discussion. It allows us to track how many comments each individual made without revealing personal identities.
Comment_ID
A unique identifier for each individual comment in the dataset.
Argument
The textual content of the comment. This field contains the actual message posted by the participant.
Date
The date on which the comment was posted.
Commenter_BA_Score
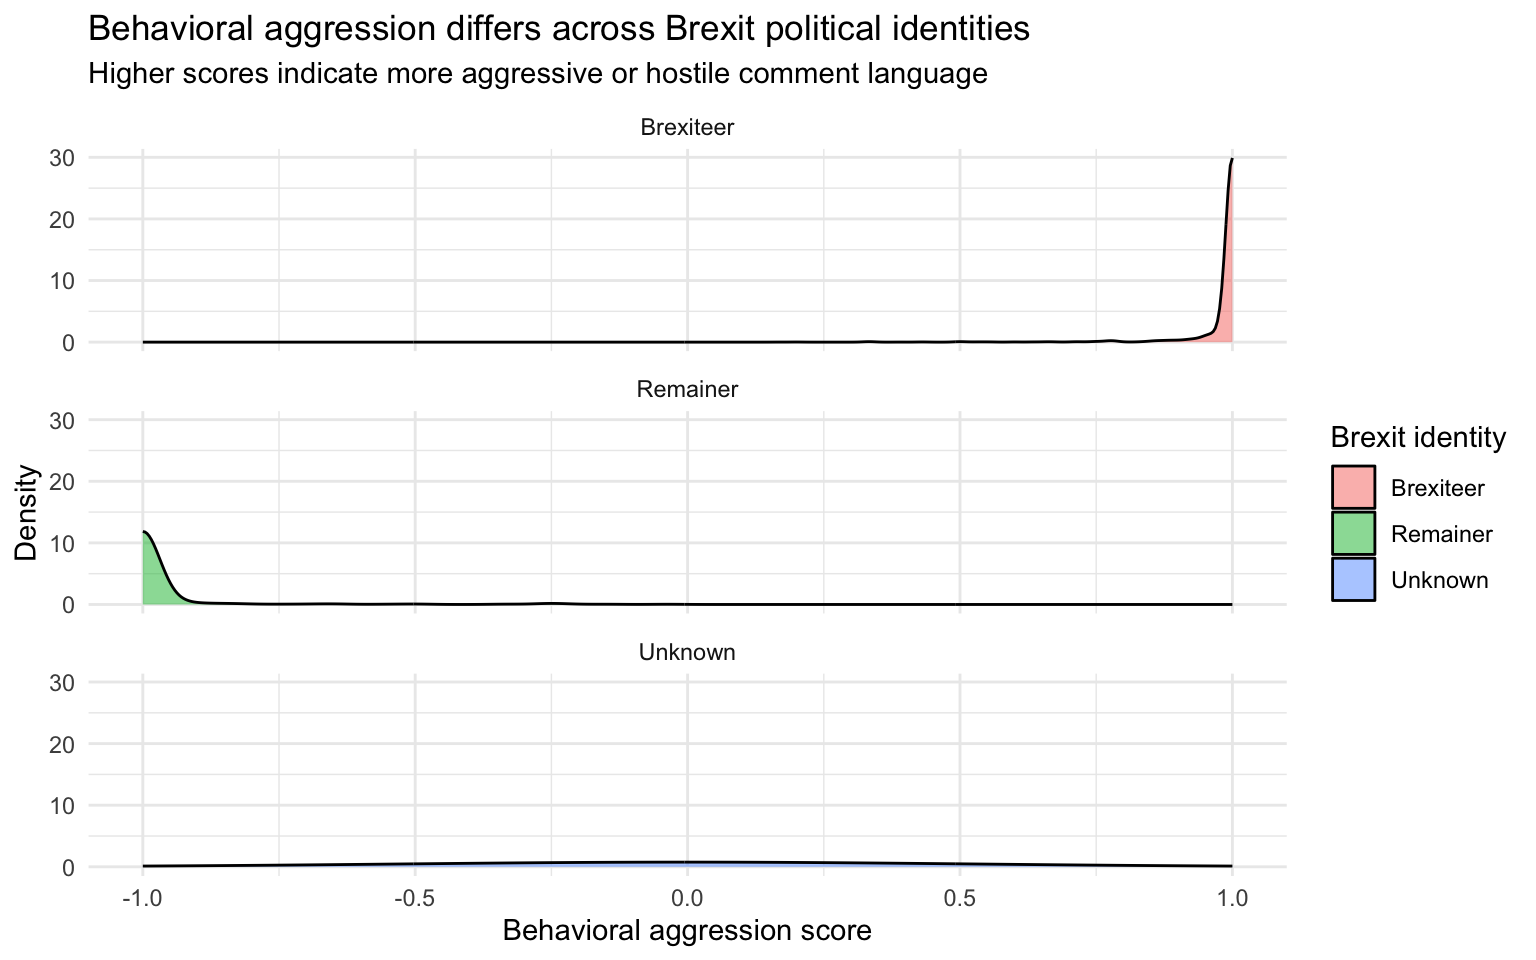
A behavioral aggression score assigned to the comment. This metric captures the tone of the comment on a scale where higher values indicate more aggressive or confrontational language, while lower values indicate less aggressive or more conciliatory language.
Brexit_Attitude
The political stance of the commenter in relation to Brexit.
Possible categories include:
Brexiteer – supportive of leaving the European Union
Remainer – supportive of remaining in the European Union
Unknown – stance could not be clearly determined from the comment
Commenter_Total_Reactions
The total number of reactions (such as likes, shares, or other engagement indicators) received by the comment. This variable provides a measure of how much attention or engagement a comment generated.
Campaign
The campaign group associated with the discussion thread where the comment was posted.
The dataset includes comments from three major campaign spaces:
LeaveEU
VoteLeave
StrongerIn
Comment_Order
The position of the comment within a discussion thread. Lower values indicate comments earlier in the conversation, while higher values indicate later responses.
Comment_Type
Describes the type of comment made in the discussion (for example, a direct argument, response, or other interaction type).
Cross_Cutting_w_Counters
Indicates whether the interaction involved disagreement between opposing viewpoints with explicit counterarguments.
Cross_Cutting_without_Counters
Indicates whether the interaction involved disagreement between opposing viewpoints without explicit counterarguments.
Chain_Comment
Indicates whether the comment is part of a longer conversational chain (a back-and-forth discussion) or a standalone comment.
Standalone – a single comment not part of a reply chain
Chain – a comment that is part of an ongoing discussion thread
Key Research Questions
This project is guided by several questions about online political discussion:
Do comment tone scores differ across Brexit political identities?
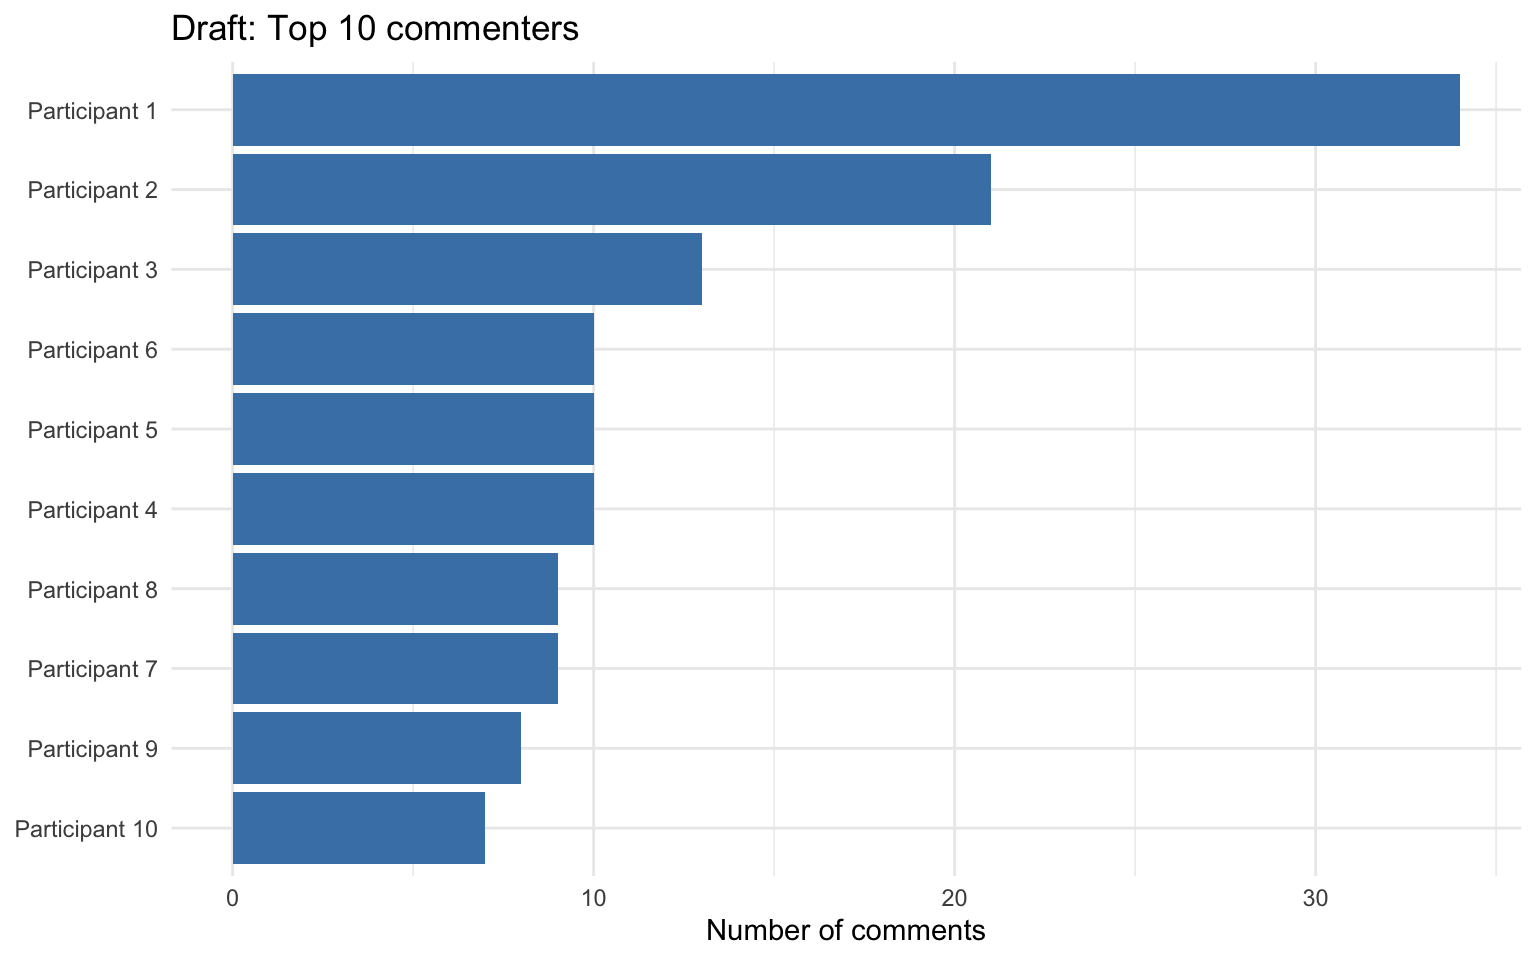
Is participation broadly shared, or dominated by a small number of users?
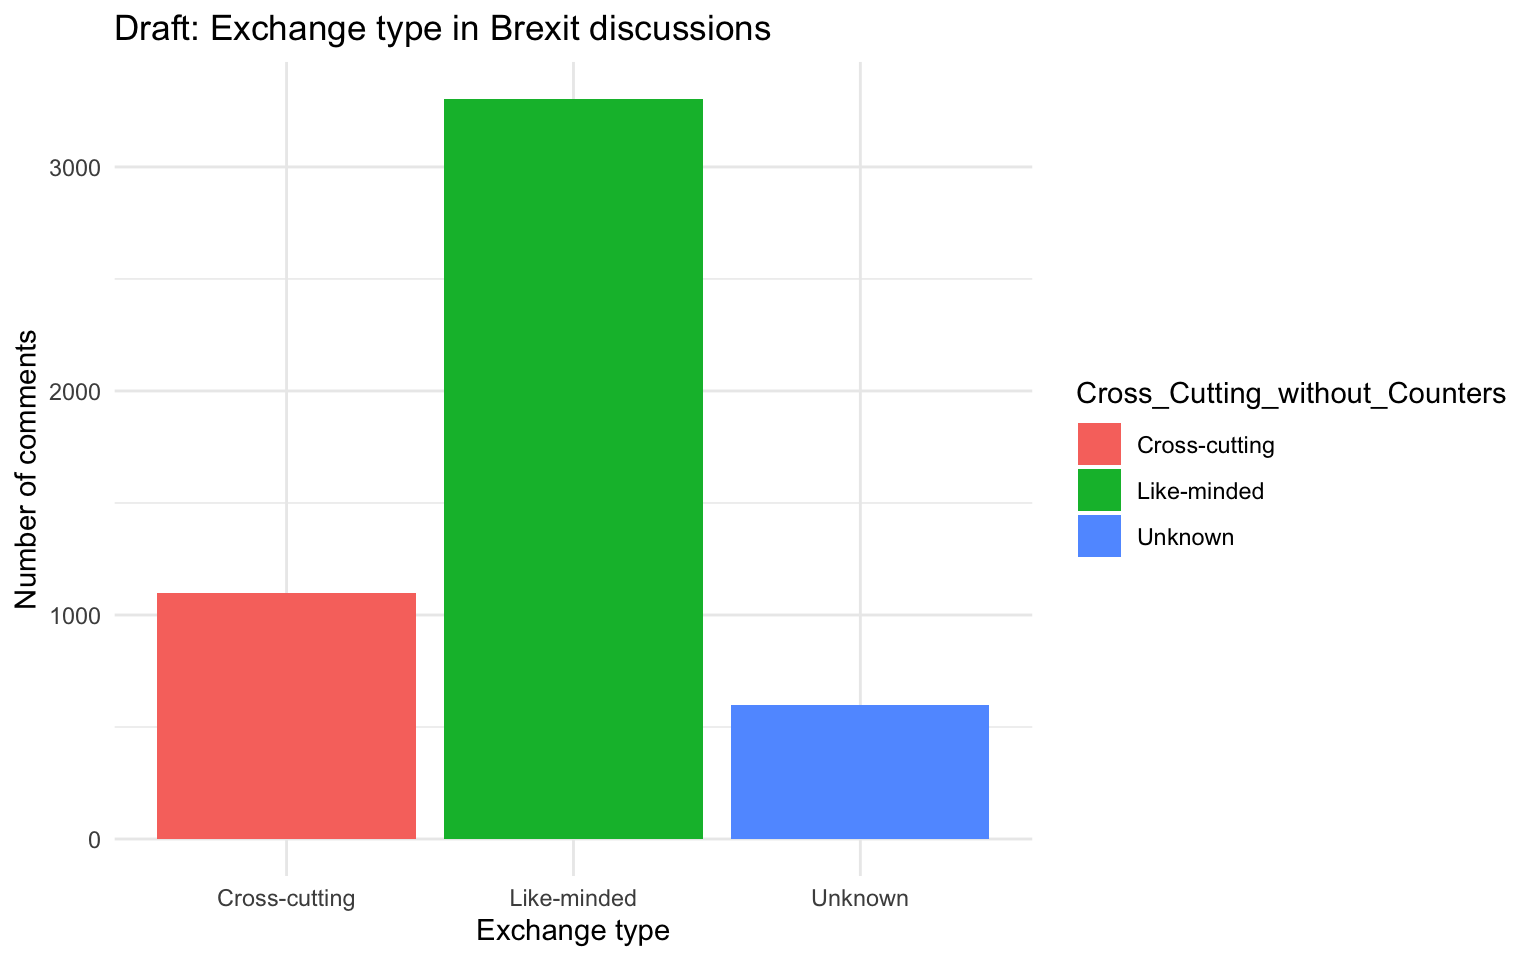
Are discussions more like-minded than cross-cutting?
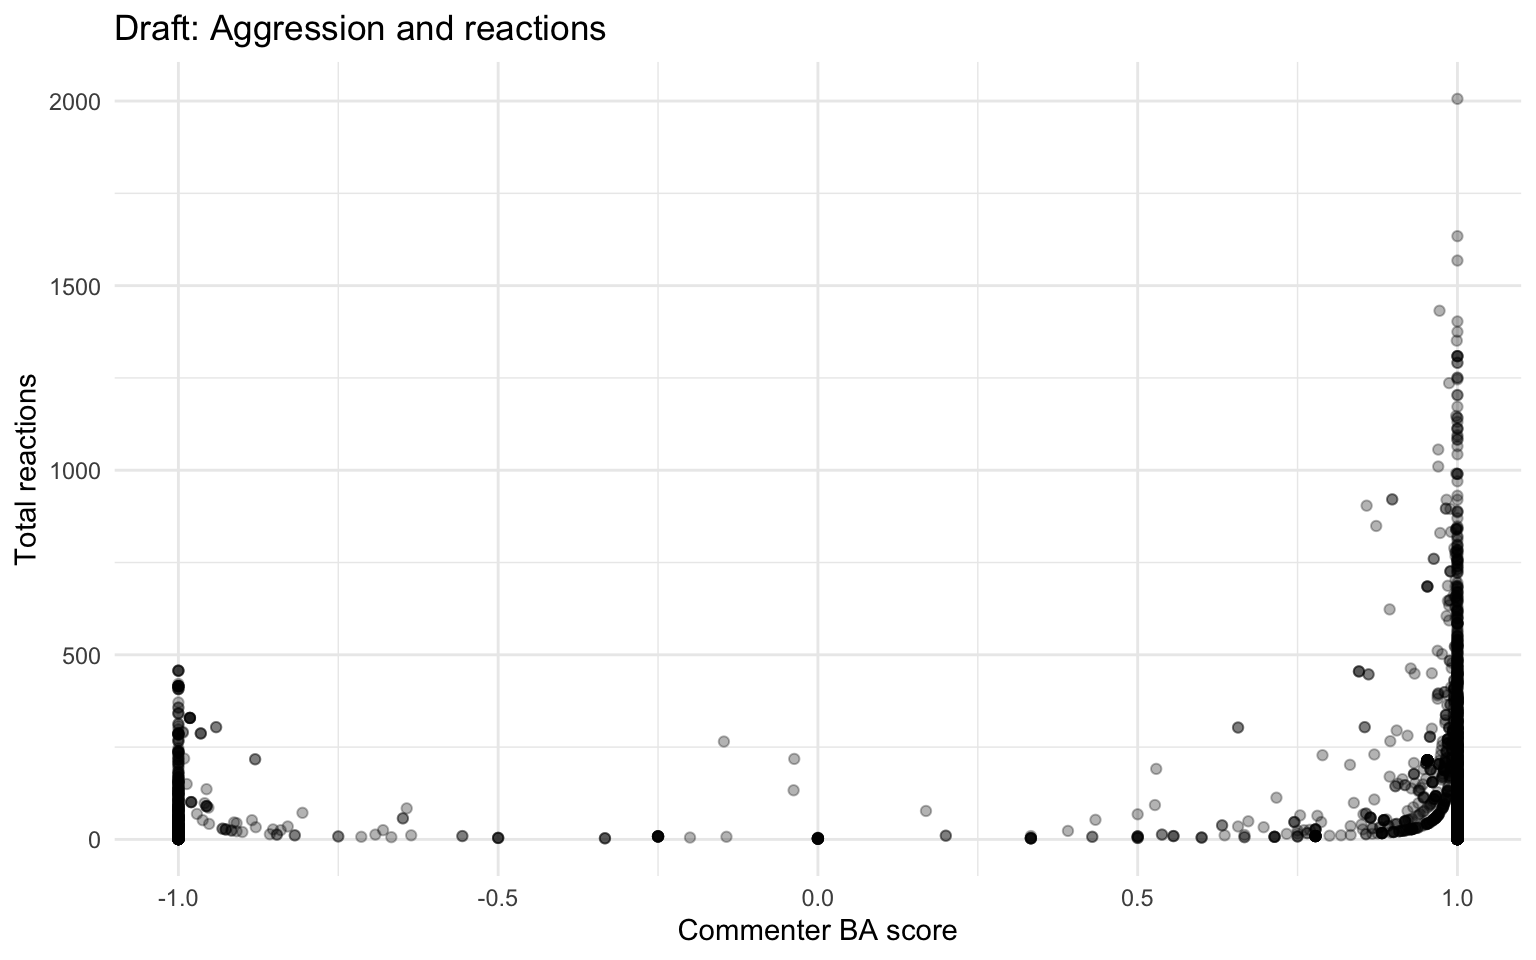
Do comments with stronger tone scores attract more reactions?
The visualizations presented in this project address these questions by examining patterns of political identity, discussion structure, participation inequality, and engagement behavior.
Project Goals
The primary goal of this project is to communicate meaningful patterns in online political discussion using clear and effective data visualization. Specifically, the project examines whether political identity is associated with differences in comment tone, whether discussions occur across opposing viewpoints or within like-minded groups, whether participation is evenly distributed or dominated by a small number of users, and whether more aggressive comments receive greater engagement.
In addition to answering these substantive questions, the project also demonstrates principles of good visualization design, including clarity, accessibility, reduction of visual clutter, and effective storytelling with data.
Intended Audience
This project is designed for students, instructors, and researchers interested in political communication, online discussion behavior, and data visualization. It is also intended for a general academic audience interested in understanding how political discussions unfold on social media. The visualizations prioritize clarity and interpretation so that viewers without advanced statistical training can easily understand the key patterns in the data.
Reproducibility
All analyses were conducted using R and the tidyverse ecosystem. The project is fully reproducible and hosted on GitHub, allowing others to review the code, reproduce the results, and understand how the visualizations were developed. The workflow follows reproducible research practices including clear documentation, consistent data cleaning steps, and transparent visualization decisions.
Visualization Development Process
A key requirement of this project is demonstrating how visualizations improved through iteration. Each visualization began as a draft version and was revised to improve readability, comparison, and interpretation. Improvements included clearer labeling, better color choices, improved layout, and the addition of reference markers to guide interpretation. These revisions reflect principles discussed in the course related to effective visual communication and audience-centered design.
Skills Demonstrated
This project demonstrates skills in data cleaning, exploratory analysis, data visualization, reproducible research, and visual storytelling. It also reflects the ability to translate complex political communication data into clear and interpretable visual explanations. More broadly, the project shows how data visualization can be used as a tool to better understand patterns of participation, disagreement, and engagement in online political environments.
References
Bossetta, M., Dutceac Segesten, A., & Bonacci, D. (2023). Reconceptualizing Cross-Cutting Political Expression on Social Media: A Case Study of Facebook Comments During the 2016 Brexit Referendum. Political Communication, 40(6), 719–741. https://doi.org/10.1080/10584609.2023.2222370
Bossetta, M. (2022). Reconceptualizing cross-cutting political expression on social media: A case study of Facebook comments during the 2016 Brexit referendum [Data set]. Open Science Framework. https://osf.io/phaeg